Showing posts with label Education. Show all posts

Sunday, December 6, 2020

China Shipping indices - CDFI and CCFI

China also has shipping indices that kind of similar to BDI and Harpex.

CDFI (China Import Dry Bulk Freight Index) reflects spot market changes in China import dry bulk transportation market


CCFI (China Containerized Freight Index)  targets the overall freight level (including spot and contractual rates) of China’s export container transport market, which is more comprehensive and macroeconomic.


Visit SCFI for more on CDFI and CCFI

Sunday, August 7, 2016

Potential resistance after historic high

It is a challenge to know when to take profit  after indices broke  historic high, therefore I am using HLY's theory (Hu Li Yang) as a guidance.

HLY's theory is potential resistance at every 15% interval from the previous historic peak.

For example. Dow peak in Oct 2007 at 13,407
The potential resistance levels are 15,418, 17,429,  19,440, 21,451, 23,462 and so on

S&P  also peak in Oct 2007 at 1,576.  The potential resistance are  1,812, 2,049, 2,285,  2,522, 2,758, ...

Nasdaq 100 peak in Mar 2000 at 4,816.  The potential resistance are 5,538, 6,261, 6,983,  7,706, 8,428, ...

Russell 2000 peak in May 2011 at 868.  The potential resistance are  998, 1,128, 1,259,  1,389, 1,519, ...

Sunday, February 28, 2016

BDI vs Harpex

Harpex will be one of the shipping index that I will be monitoring
Below is the summary BDI vs Harpex


Sunday, September 20, 2015

Hu Li Yang (胡立阳) sharing sumamry

Here are some of the pointers from Hu Li Yang that I have summarized it from the talk I went before

1) Statistic based on 40 countries, typically
  • the more challenging month for trading are Aug, Jul and Oct
  • the more easier month for trading are Nov, Dec and Jan

2) When the markets recovering after the crash, the potential strong resistance will be double from the lowest point.  The subsequent resistance will be every 5% of the double of the lowest point.

3) Bull market definition – continuous 3 white bar in monthly chart and rise more than 30%
3a) Symptom of bull market

  • Ignore bad news, sensitive to good news
  • 10day MA has turned up
  • Weekly candle has 2 up weeks
  • 3 month MA has turned up
3b) Warning sign of weakening of bull market
  • 3 days down continuous OR 4 days down in a 5 days trading week
  • Index should not drop more than 2% a day from peak or 10% in 3 days
4) Bear market definition – continuous 3 black bar in monthly chart and drop more than 25%
4a & b) symptom and warning of bear market will be opposite of bull market

5) 10 days MA use to determine whether is the stock alive or dead for short term

Sunday, August 2, 2015

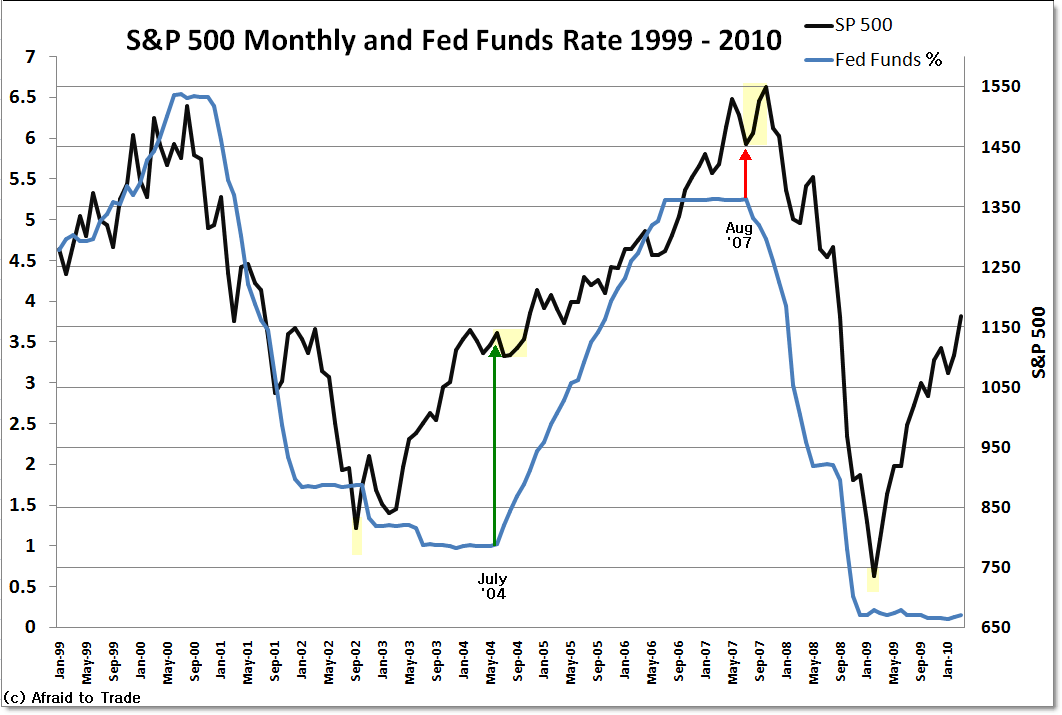
Are you ready for Fed rate hike?

One my of friend share with an information on markets will rise after Fed rate hike, I google for it and found some interesting write out to share

1) Historical lessons from Federal Reserve rate-hike cycles (Published in Oct 2014)
by Allianz GI Global Capital Markets & Thematic Research
Quite comprehensive write out comparing the similarity and differences of the last 6 Fed rate hike cycle since 1983


3) Chart Of The Day: Interest Rates Vs. S&P 500  (Published in 17 Jun 2013)