Monday, August 10, 2015

Commodities Update - 08 Aug 15

BDI closed at 1200 (07 Aug) from 1131 (31 Jul)

Summary
Grains continue to closed mixed while Energy and metals closed lower.

COT
Instruments that show buying interest
(3) by Producer/Merchant/Processor/User
Down Trend

  • Sugar 
  • Coffee Arabica (1)
  • Oats (1)
  • Gasoline
  • Copper
  • Gold
  • Silver (1)
  • Palladium (1)
  • Platinum
Neutral
  • Lumber
Up Trend
  • None

Instruments that show selling interest at extreme
(2) only by Producer/Merchant/Processor/User
Up Trend

  • Soybean Meal
Neutral
  • None
Down Trend
  • Feeder Cattle


Note
(1) COT Index >= 90
(2) COT Index <= 10
(3) COT Index >= 70, rising COT Index, monitor for trend reversal from DT to UT

Down Trend and Up Trend is based on 50 Simple Moving Average


Indices short term support and resistance


Australia
Daily DT, Weekly Neutral
New diff had formed and broke down after failed to break Diff and hold above TL2.  Now back to multiple support include channel support.  Previously channel support had a false break down for few days before it recovered.
Potential resistance around 5,463, 5,528 and 5,617
Potential support around 5,424, 5,316 and 5,138

Japan
UT
A new diff is formed.  Forming triangle for a break out or break down.
Potential resistance around  20,900, 22,500^ and 23,900^ 

Potential support around  20,474, 20,052, 19,740 and 19,092
^Est figure using chart provided by Yahoo finance

Hong Kong
Daily DT, Weekly Neutral 
In consolidation mode.  Weekly formed an inside day
Potential resistance around 24,892, 25,571 and 26,681
Potential support around  23,969, 22,409 and 21,682

Hong Kong China H-Shares
Daily DT, Weekly UT.
In consolidation mode.  Weekly chart closed with +roc, weekly diff supported for 2 weeks.
Potential resistance around 11,366, 11,821, 12,404 and 13,021
Potential support around   11,080, 10,711 and 10,450

UK
Daily DT, Weekly Neutral
UK had broke TL2 and closed 2 days above TL2 but 2 inside days, potential for big movement coming. For more upside, need to close above TL2.
Potential resistance around 6,809, 6,949 and 7,047
Potential support around 6,578, 6,489, 6,429 and 6,297

Germany
Daily DT, Weekly UT
Broke TL1 but resisted by TL2,  On Fri broke pdl and a new diff is created.  Retracement support will be at TL3, c
losing below will be bearish in short term.
 Potential resistance around 11,532, 11,774, 11,994 and 12,238
Potential support around  11,147, 10,930 and 10,653

India
UT
Any retracement, TL1 will be the support
, closing below will be bearish in short term.
 Potential resistance around 8,578, 8,705, 8,836 and 9,006
Potential support around 8,483, 8,435, 8,311 and 8,223

Key event to watch out  (SG Time)
11 Aug, Tue

  • 1700 German ZEW Economic Sentiment (Aug) 
12 Aug, Wed
  • 1330 CNY Industrial Production (YoY) (Jul)  
  • 1630 GBP Average Earnings Index +Bonus (Jun)
  • 1630 GBP Claimant Count Change (Jul)  
13 Aug, Thu
  • 2030 US Core Retail Sales (MoM) (Jul) 
  • 2030 Retail Sales (MoM) (Jul)  
14 Aug, Fri
  • 1400 German GDP (QoQ) (Q2)  
  • 1700 EUR CPI (YoY) (Jul)
  • 2030 US PPI (MoM) (Jul) 

Indices Performance Chart - 07 Aug 15

US markets closed lower while most in Asia edge slightly higher while Europe are mixed.

Instruments that show buying interest from Dealer/Intermediary (sell-side participants)
UT

  • None
Neutral
  • Nasdaq (increased for 1st week)
DT
  • Dow (3) (decreased for 1st week)
  • S&P (1) (increased for 2nd week)
  • Russell (increased for 2nd week)
Note
(1) COT Index >= 90
(2) COT Index <= 10
(3) COT Index >= 70, rising COT Index, monitor for trend reversal from DT to UT


After recovered from last week, Dow, Nasdaq and Russell broke pwl.  S&P formed an inside day.  Dow and Russell had tested long term support, if next week fail to trade above long term support, may see more selling.

Had closed my added long pos with small profit or small losses.  I will continue to monitor and add small pos if break lhf and above Diff SL


Dow
Daily DT, Weekly UT
For Dow to continue UT, it will need to trade and closed above long term trend line (white color) for 2-3 days 

Potential resistance around 17,502, 17,775 and 17,922Potential support around 17,271, 17,083 and 16,503

S&P
Daily DT, Weekly UT
S&P formed inside day in weekly chart.  A new diff is formed.  Currently supported weekly Diff and TL5.  To continue UT, must not closed below 2061 for more than 3 days.
Potential resistance around  2,088, 2,116, 2,129 and 2,137
Potential support around 2,061, 2,045 and 2,028

Nasdaq
Daily Neutral, Weekly UT
Nasdaq need to close above TL3 and Weekly Diff (4,512) for more upside.  Next immediate support will be 4347.
Potential resistance around 4,537, 4,640 and 4,682
Potential support around  4,347, 4,271 and 4,089

Russell
Daily DT, Weekly UT
Resisted by TL1 and TL3, need to closed above 1213 for 2-3 days for more upside, or else testing at 1,185.
Potential resistance around 1,213, 1,240 and 1,257
Potential support around 1,185, 1,164 and 1,137

Sunday, August 2, 2015

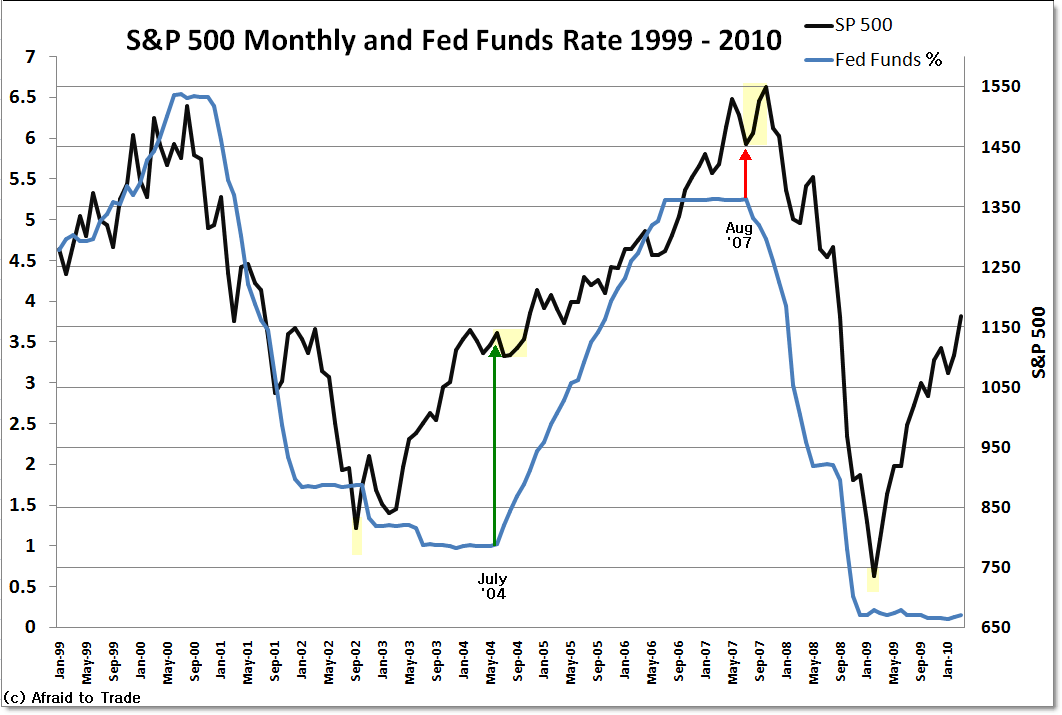
Are you ready for Fed rate hike?

One my of friend share with an information on markets will rise after Fed rate hike, I google for it and found some interesting write out to share

1) Historical lessons from Federal Reserve rate-hike cycles (Published in Oct 2014)
by Allianz GI Global Capital Markets & Thematic Research
Quite comprehensive write out comparing the similarity and differences of the last 6 Fed rate hike cycle since 1983


3) Chart Of The Day: Interest Rates Vs. S&P 500  (Published in 17 Jun 2013)


Gold and Silver


DT
In consolidation mode, moving within Diff.  Will not trade till clearer signal on break out or break down.  The longer the consolidation period, the higher probability of explosive movement

Dollar Index wild swing closed with little change

Dollar Index closed with little change at 97.44.Dollar Index had a wild swing on Fri broke support and recovered.  Dollar Index is supported by trend line TL2 and around 96.3 level but resisted by trend line TL3

USD Impact currencies/Gold/Crude(wow)

Weekly chart with 50 SMA