Monday, October 22, 2018
No update for this week
Due to unforeseen circumstance, this blog will not be updated this week due to personal commitments.

Sunday, October 14, 2018
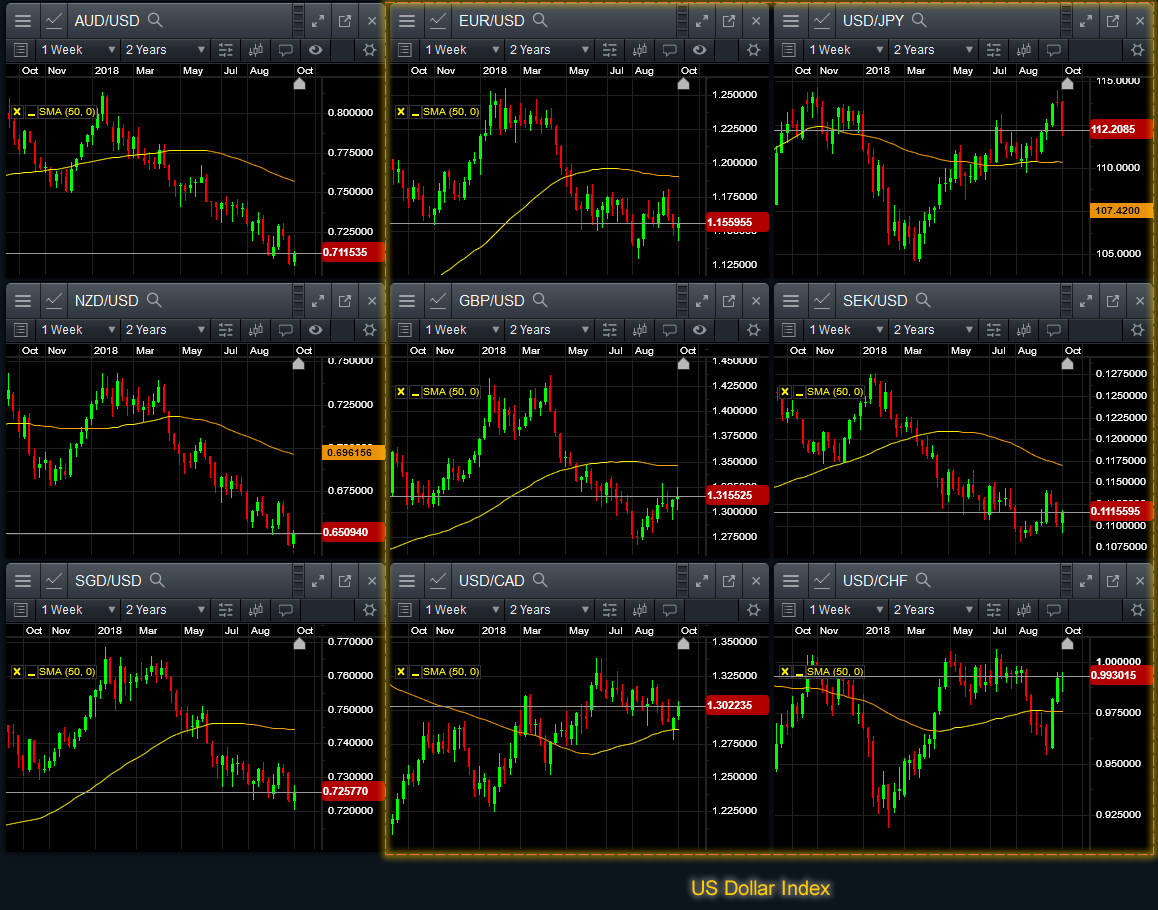
Dollar Index broke support
After it failed to close above TLU1, it broke and closed below 95.0 level.
Resistance at 95.0, TLU1, 96.3, 97.3, 98.7
Support at 94.0, 93.3, 92.0, 90.6


Resistance at 95.0, TLU1, 96.3, 97.3, 98.7
Support at 94.0, 93.3, 92.0, 90.6

COT for Dollar Index

Weekly chart with 50 SMA
Commodities Update 13 Oct 18
BDI closed at 1579 (12 Oct)
Harpex closed at 532.28 (05 Oct)
COT
Instruments that show selling interest at extreme (2) only by Producer/Merchant/Processor/User
Up Trend
Note
(1) COT Index >= 90, Buying interest at extreme
(2) COT Index <= 10, Selling interest at extreme
(3) COT Index >= 70, rising COT Index, monitor for trend reversal
Down Trend and Up Trend is based on 50 Simple Moving Average
Harpex closed at 532.28 (05 Oct)
COT
Download Commodities COT
Instruments that show buying interest (3) by Producer/Merchant/Processor/User
Down Trend
Instruments that show buying interest (3) by Producer/Merchant/Processor/User
Down Trend
- Cocoa
- Soybeans
- Corn
- Silver
- Orange Juice
- Rough Rice
Neutral
- Coffee
- Gold (1)
- Platinum
Up Trend
- Sugar
- Natural Gas (1)
- Crude (1)
Instruments that show selling interest at extreme (2) only by Producer/Merchant/Processor/User
Up Trend
- None
- None
Down Trend
- None
Note
(1) COT Index >= 90, Buying interest at extreme
(2) COT Index <= 10, Selling interest at extreme
(3) COT Index >= 70, rising COT Index, monitor for trend reversal
Down Trend and Up Trend is based on 50 Simple Moving Average
US Markets 13 Oct 18
US markets slumped down. On the weekly charts, it tested one of the strong support level and closed above it.
Dollar Index broke 95.0 support level and closed below.
Watch out for US FOMC Meeting Minutes on 18 Oct 0200 Hrs and China GDP on 19 Oct.
Instruments that show buying interest (3) from Dealer/Intermediary (sell-side participants)
UT
Instruments that show selling interest at extreme (2) by Dealer/Intermediary (sell-side participants)
UT
COT show dealer seems to be picking up, any entry goes small for now.

Note
(1) COT Index >= 90, Buying interest at extreme
(2) COT Index <= 10, Selling interest at extreme
(3) COT Index >= 70, rising COT Index, monitor for trend reversal
Down Trend and Up Trend is based on 50 Simple Moving Average


Dow
S&P
Daily Neutral, Weekly UT
Nasdaq
Daily Neutral, Weekly UT
Russell
Daily DT, Weekly UT
Potential resistance around 1,585, 1,609, 1,624, 1,683, 1,708, 1,743
Dollar Index broke 95.0 support level and closed below.
Watch out for US FOMC Meeting Minutes on 18 Oct 0200 Hrs and China GDP on 19 Oct.
Instruments that show buying interest (3) from Dealer/Intermediary (sell-side participants)
UT
- None
- Nasdaq
- None
Instruments that show selling interest at extreme (2) by Dealer/Intermediary (sell-side participants)
UT
- None
- None
- None
COT show dealer seems to be picking up, any entry goes small for now.

Note
(1) COT Index >= 90, Buying interest at extreme
(2) COT Index <= 10, Selling interest at extreme
(3) COT Index >= 70, rising COT Index, monitor for trend reversal
Down Trend and Up Trend is based on 50 Simple Moving Average


Dow
Daily Neutral, Weekly UT
Potential resistance around 25,649, 25,784, 26,627, TLU11, 26,976, 29,106
Potential resistance around 25,649, 25,784, 26,627, TLU11, 26,976, 29,106
Potential support around 25,336, 24,841, 24,170, 23,567, 23,435, 23,175
S&P
Daily Neutral, Weekly UT
Potential resistance around 2,786, 2,814, 2,825, 2,874, 2,940, 2,983, 3,219
Potential support around 2,710, 2,593 2,551, 2,506, 2,480, 2,450
Nasdaq
Daily Neutral, Weekly UT
Potential resistance around 7,282, TLU6, 7,516, 7,706, TLU7, 8,428
Potential support around 7,134, 6,982, 6,857, TLU3, 6,346, TLU4, 6,261
Russell
Daily DT, Weekly UT
Potential resistance around 1,585, 1,609, 1,624, 1,683, 1,708, 1,743
Potential support around 1,543, 1,519, 1,508, 1,494, 1,451, 1,420, 1,388
Key event to watch out (SG Time)
15 Oct, Mon- 2030 US Core Retail Sales (MoM) (Sep)
- 2030 US Retail Sales (MoM) (Sep)
- 0545 New Zealand CPI (QoQ) (Q3)
- 0930 Australia RBA Meeting Minutes
- 1630 UK Average Earnings Index +Bonus (Aug)
- 1630 UK Claimant Count Change (Sep)
- 2200 US JOLTs Job Openings (Aug)
- HK holiday
- 1630 UK CPI (YoY) (Sep)
- 1700 Europe CPI (YoY) (Sep)
- 2030 US Building Permits (Sep)
- 2230 US Crude Oil Inventories
- 0200 US FOMC Meeting Minutes
- 0830 Australia Employment Change (Sep)
- 1630 UK Employment Change (Sep)
- 2030 US Philadelphia Fed Manufacturing Index (Oct)
- 1000 China GDP (YoY) (Q3)
- 1000 China Industrial Production (YoY) (Sep)
- 2030 Canada Core CPI (MoM) (Sep)
- 2030 Canada Core Retail Sales (MoM) (Aug)
Sunday, September 30, 2018
No update for next 2 weeks
This blog will not be updated for the next 2 weeks due to personal and work commitments.
Dollar Index recovered
On the weekly chart, it broke lhf but gain was trimmed before closing. It need to stay above 95.0 resistance to be positive.
Resistance at 95.0, TLU1, 96.3, 97.3, 98.7
Support at 94.0, 93.3, 92.0, 90.6

COT for Dollar Index

Weekly chart with 50 SMA

Resistance at 95.0, TLU1, 96.3, 97.3, 98.7
Support at 94.0, 93.3, 92.0, 90.6

COT for Dollar Index

Weekly chart with 50 SMA

Subscribe to:
Posts (Atom)