Most indices are trade within ranges 23 Aug on weekly chart and some are forming symmetrical triangle, do monitor for break out or breakdown after US interest rate decision.
Australia
DT
Forming symmetrical triangle, resisted by TL1 and supported by TL6
Potential resistance around 5,138, 5,266, 5,316 and 5,463
Potential support around 5,025, 4,833, 4,696 and 4,601
Japan
Daily DT, Weekly UT
Forming symmetrical triangle, resisted by TL5 and supported by TL6
Potential resistance around 18,565, 19,092, 19,740 and 20,052
Potential support around 17,890, 17,328, 16,581 and 15,418
Hong Kong
DT
Range bound between 22,409 and 20,011
Potential resistance around 21,682, 22,409 and 23,969
Potential support around 21,080, 20,011, 19,073 and 18,051
Hong Kong China H-Shares
DT
Resisted by TL1, if recent low 9,006 is broken and close below for 2-3 days may see testing new low
Potential resistance around 10,182, 10,711, 11,080 and 11,366
Potential support around 9,658, 9,195, 8,637, 8,102 and 6,727
UK
DT
Broke lhf on weekly chart but unable to hold and closed below pwh.
If can close above TL3 for 2-3 days may see more upside
Potential resistance around 6,297, 6,429, 6,578 and 6,809
Potential support around 6,125, 6,070, 6,010, 5,894 and 5,637
Germany
Daily DT, Weekly UT
Similiar to UK, broke lhf on weekly chart and closing failed to stay above pwh.
Immediate resistance TL6 and 10,653, more upside if can close above TL6 for 2-3 days
Potential resistance around 10,272, 10,653, 10,930 and 11,147
Potential support around 9,924, 9,679, 9,468 and 9,216
India
Daily DT, Weekly Neutral
Resisted by DT upper channel, more upside if can close above DT channel for 2-3 days
Potential resistance around 7,812, 7,929, 7,991 and 8,085
Potential support around 7,538, 7,417 and 7,216
Key event to watch out (SG Time)
15 Sep, Tue
- 1630 GBP CPI (YoY) (Aug)
- 1700 EUR German ZEW Economic Sentiment (Sep)
- 2030 USD Core Retail Sales (MoM) (Aug)
- 2030 USD Retail Sales (MoM) (Aug)
16 Sep, Wed
- 1630 GBP Average Earnings Index +Bonus (Jul)
- 1630 GBP Claimant Count Change (Aug)
- 1700 EUR CPI (YoY) (Aug)
- 2030 USD Core CPI (MoM) (Aug)
17 Sep, Thu
- India Holiday
- 0645 NZD GDP (QoQ) (Q2)
- 1630 GBP Retail Sales (MoM) (Aug)
- 2030 USD Building Permits (Aug)
- 2200 USD Philadelphia Fed Manufacturing Index (Sep)
18 Sep, Fri
- 0200 FOMC Economic Projections, FOMC Statement
- 0200 Fed Chair Yellen Speaks
- 0200 Fed Interest Rate Decision
- 2030 CAD Core CPI (MoM) (Aug)
US and Asia closed higher while Europe closed mixed
Instruments that show buying interest from Dealer/Intermediary (sell-side participants)
UT
Neutral
DT
- Dow (1) (decreased for 1st week)
- S&P (1) (no change)
- Nasdaq (1) (no change)
- Russell (1) (decreased for 1st week)
Note
(1) COT Index >= 90
(2) COT Index <= 10
(3) COT Index >= 70, rising COT Index, monitor for trend reversal from DT to UT
US markets continue with consolidation and forming inside day of 23 Aug in weekly chart. A new weekly diff is formed. Expect volatile movement on Fri morning 2 AM (SG TIme) on US interest rate decision.
I will go small and short term trading or wait to trade after US interest rate decision
Dow
DT
Potential resistance around 16,503,17,083, 17,271 and 17,500
Potential support around 16,246, 15,851, 15,376 and 14,812
S&P
DT
Potential resistance around 1,973, 1,996, 2,028 and 2,045
Potential support around 1,930, 1,886, 1,820 and 1,737
Nasdaq
Daily DT, Weekly UT
Potential resistance around 4,347, 4,537, 4,640 and 4,682
Potential support around 4,271, 4,193, 4,089, 3,956 and 3,755
Russell
Daily DT, Weekly Neutral
Potential resistance around 1,164, 1,185, 1,213 and 1,240
Potential support around 1,137, 1,114 and 1,082
Dollar Index tested 96.3 but closed below it. TL2 and 95.3 level are the support for Dollar Index.
USD Impact currencies/Gold/Crude(wow)
Weekly chart with 50 SMA
BDI continue to lower to 875 (04 Sep) from 903 (28 Aug)
Summary
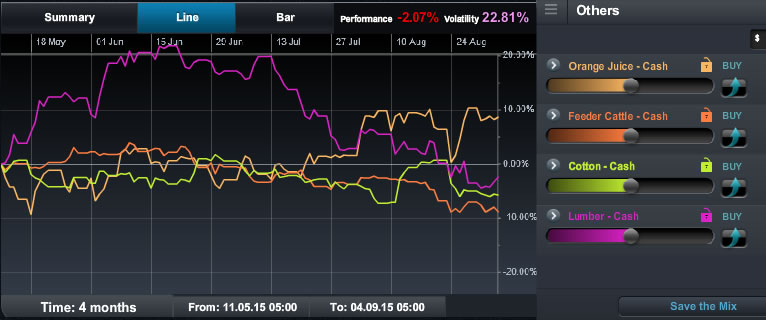
Sugar and cocoa closed higher this week while the rest closed lower.
COT
Instruments that show buying interest (3) by Producer/Merchant/Processor/User
Down Trend
- Coffee Arabica (1)
- Sugar (1)
- wheat
- Oats (1)
- Gasoline
- Natural Gas
- Copper
- Silver
- Palladium (1)
- Lumber (1)
Neutral
Up Trend
Instruments that show selling interest at extreme (2) only by Producer/Merchant/Processor/User
Up Trend
Neutral
Down Trend
Note
(1) COT Index >= 90
(2) COT Index <= 10
(3) COT Index >= 70, rising COT Index, monitor for trend reversal from DT to UT
Down Trend and Up Trend is based on 50 Simple Moving Average
Australia
DT
Broke hlf on Mon. Resisted by TL5, supported by TL3 and 4,833.
Potential resistance around 5,025, 5,138, 5,266 and 5,316
Potential support around 4,833, 4,696 and 4,601
Japan
Daily DT, Weekly UT
Broke hlf on Mon and continue to trade lower. Resisted by TL5, supported by TL6 and 17,328.
Potential resistance around 17,890, 18,565, 19,092, 19,740 and 20,052
Potential support around 17,328, 16,581 and 15,418
Hong Kong
DT
Broke hlf on Mon, new diff created and closed below Diff on Fri. Resisted by TL3.
Potential resistance around 21,080, 21,682, 22,409 and 23,969
Potential support around 20,011, 19,073 and 18,051
Hong Kong China H-Shares
DT
Broke hlf on Mon and broke recent low (24 Aug) on Fri. Closing above TL3 for 2-3 days may have potential upside
Potential resistance around 9,195, 9,658, 10,182 and 10,711
Potential support around 8,637, 8,102 and 6,727
UK
DT
Broke hlf on Tue and the following 3 days trade within Tue range. If can close above TL5 for 2-3 days may see some upside
Potential resistance around 6,070, 6,125, 6,297, 6,429 and 6,578
Potential support around 6,010, 5,894 and 5,637
Germany
Daily DT, Weekly UT
Broke hlf on Mon, tested pwh on Thu but failed to hold
Immediate support TL4 and 9,924, more upside if can close above TL5 for 2-3 days
Potential resistance around 10,272, 10,653, 10,930 and 11,147
Potential support around 9,924, 9,679, 9,468 and 9,216
India
Daily DT, Weekly Neutral
Back to trading within DT channel, more upside if can close above DT channel and TL3 for 2-3 days
Potential resistance around 7,812, 7,929, 7,991 and 8,085
Potential support around 7,538, 7,417 and 7,216
Key event to watch out (SG Time)
07 Sep, Mon
- Canada - Labour Day
- United States - Labor Day
08 Sep, Tue
- 1000 CNY Trade Balance (Aug)
09 Sep, Wed
- 1000 CNY CPI (YoY) (Aug)
- 1630 GBP Manufacturing Production (MoM) (Jul)
- 2200 CAD Interest Rate Decision
10 Sep, Thu
- 0500 NZD Interest Rate Decision
- 0930 AUD Employment Change (Aug)
- 0930 CNY CPI (YoY) (Aug)
- 1900 GBP Interest Rate Decision (Sep)
11 Sep, Fri
12 Sep, Sat
- 1330 CNY Industrial Production (YoY) (Aug)
Markets closed lower between 1-5% after technical rebound
Instruments that show buying interest from Dealer/Intermediary (sell-side participants)
UT
Neutral
DT
- Dow (1) (increased for few weeks)
- S&P (1) (increased for 2nd week)
- Nasdaq (1) (increased for 2nd week)
- Russell (1) (increased for few weeks)
Note
(1) COT Index >= 90
(2) COT Index <= 10
(3) COT Index >= 70, rising COT Index, monitor for trend reversal from DT to UT
A new Diff is formed week. Wed to Fri are trading between Tue dl and dh. There is a false break on Wed and closed with doji on Wed. On weekly chart, inside day is formed. On daily chart, the direction is not clear, I will prefer to wait for clearer signal (for eg. above Diff) to build up long pos on every lhf
Dow
DT
Potential resistance around 16,246, 16,503, 17,083 and 17,271
Potential support around 15,851, 15,376 and 14,812
S&P
Daily DT, Weekly Neutral
Potential resistance around 1,930, 1,973, 1,996 and 2,028
Potential support around 1,886, 1,820 and 1,737
Nasdaq
Daily DT, Weekly UT
Potential resistance around 4,193, 4,271, 4,347 and 4,537
Potential support around 4,089, 3,956 and 3,755
Russell
Daily DT, Weekly Neutral
Potential resistance around 1,164, 1,185, 1,213 and 1,240
Potential support around 1,137, 1,114 and 1,082