Sunday, August 30, 2020

Dollar Index closed lower

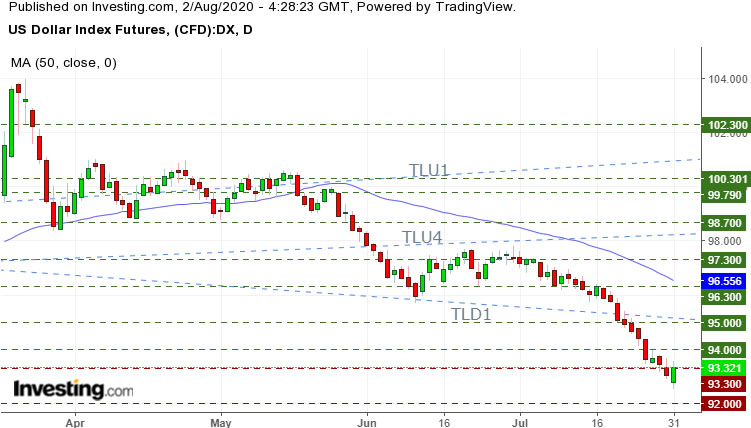
On the weekly chart, Dollar Index closed lower with an inside day
Resistance at 93.3, 94.0, 95.0, TLD1, 96.3, 97.3, TLU4, 98.7, 99.8, 100.3
Support at 92.0, 90.6, 88.88


COT for Dollar Index

Weekly chart with 50 SMA

Commodities Update 29 Aug 2020

BDI edged higher to 1,488 (29 Aug) from 1,481 (21 Aug)
Harpex rallied to 627.11 (21 Aug) from 596.69 (14 Aug)

COT 

Download Commodities COT
Instruments that show buying interest (3) by Producer/Merchant/Processor/User
Down Trend
  • None
Neutral
  • Corn
Up Trend
  • Natural Gas (1)
  • Gasoline
  • Palladium

Instruments that show selling interest at extreme (2) only by Producer/Merchant/Processor/User
Up Trend
  • Soybean
  • Coffee
Neutral
  • None
Down Trend
  • None

Note
(1) COT Index >= 90, Buying interest at extreme
(2) COT Index <= 10, Selling interest at extreme
(3) COT Index >= 70, rising COT Index, monitor for a trend reversal
Down Trend and Up Trend is based on 50 Simple Moving Average

US Market 29 Aug 2020

US market closed higher.  S&P and Nasdaq closed at a historic high.  On the weekly chart, Dow broke lhf (lower-high formation) while Russell closed with an inside day

BDI and Harpex closed higher.

Dollar Index closed lower.

Watch out for 

  • various countries releasing Manufacturing PMI data
  • NFP data on Fri

Instruments that show buying interest (3) from Dealer/Intermediary (sell-side participants)
UT 
  • Dow
  • S&P
  • Russell
Neutral 
  • None
DT 
  • None

Instruments that show selling interest at extreme (2) by Dealer/Intermediary (sell-side participants)
UT 
  • None
Neutral 
  • None
DT 
  • None
Note
(1) COT Index >= 90, Buying interest at extreme
(2) COT Index <= 10, Selling interest at extreme
(3) COT Index >= 70, rising COT Index, monitor for trend reversal
Down Trend and Up Trend is based on 50 Simple Moving Average


Dow
Daily UT, Weekly Neutral
Potential resistance around 28,730, 29,106, 29,407
Potential support around 28,195, 27,345, 26,635, 25,784, 25,336, 24,837

S&P
Daily UT, Weekly UT
Potential resistance around 3,690, 3,925
Potential support around 3,454, 3,391, 3,388, 3,303, 3,219, 3,155, 3,072, 3,022

Nasdaq
Daily UT
, Weekly UT
Potential resistance around 12,040, 12,762, 13,485
Potential support around 11,318, 10,856, 10,595, 10,206, 9,873, 9,723, 9,243, 8,781

Russell
Daily 
UT, Weekly Neutral
Potential resistance around
 1,585, 1,609, 1,624, 1,649
Potential support around 1,543, 1,519, 1,498, 1,451, 1,420, 1,388, 1,341, 1,296

Key event to watch out  (SG Time, GMT+8)

31 Aug, Mon

  • UK holiday
  • 0900 China Manufacturing PMI (Aug)
  • 2000 German Harmonized Index of Consumer Prices (YoY)
  • 2030 Canada Building Permits (MoM)

01 Sep, Tue

  • 0945 China Caixin Manufacturing PMI (Aug)
  • 1230 Australia RBA Interest Rate Decision (Sep)
  • 1230 Australia RBA Rate Statement  
  • 1555 German Manufacturing PMI (Aug)
  • 1555 German Unemployment Change (Aug)
  • 1630 UK Manufacturing PMI (Aug)
  • 1700 Europe CPI (YoY) (Aug)  
  • 2200 US ISM Manufacturing PMI (Aug)

02 Sep, Wed

  • 0930 Australia GDP (QoQ) (Q2)
  • 2015 US ADP Nonfarm Employment Change (Aug)
  • 2230 US Crude Oil Inventories 

03 Sep, Thu

  • 0930 Australia Trade Balance
  • 1630 UK Composite PMI (Aug)
  • 1630 UK Services PMI (Aug)
  • 1700 Europe Retail Sales (YoY)
  • 2030 US Initial Jobless Claims
  • 2030 US Trade Balance
  • 2200 UK BoE Gov Bailey Speaks  
  • 2200 US ISM Non-Manufacturing PMI (Aug)

04 Sep, Fri

  • 0930 Australia Retail Sales (MoM) (Jul)
  • 1630 UK Construction PMI (Aug)
  • 2030 US Nonfarm Payrolls (Aug)
  • 2030 US Unemployment Rate (Aug)
  • 2030 Canada Employment Change (Aug)
  • 2200 Canada Ivey PMI (Aug)

Sunday, August 23, 2020

Dollar Index broke hlf

On the weekly chart, the Dollar Index broke hlf (higher-low formation) and recovered to close higher.
Resistance at 93.3, 94.0, 95.0, TLD1, 96.3, 97.3, TLU4, 98.7, 99.8, 100.3
Support at 92.0, 90.6, 88.88

COT for Dollar Index


Weekly chart with 50 SMA

Commodities Update 22 Aug 2020

BDI closed lower from 1,595 (14 Aug) to 1,481 (21 Aug)

Harpex closed higher to 596.69 (14 Aug) from 556.13 (07 Aug)

COT 
Download Commodities COT
Instruments that show buying interest (3) by Producer/Merchant/Processor/User
Down Trend
  • Corn
Neutral
  • None
Up Trend
  • Natural Gas (1)
  • Gasoline
  • Palladium

Instruments that show selling interest at extreme (2) only by Producer/Merchant/Processor/User
Up Trend
  • Soybean
Neutral
  • None
Down Trend
  • None

Note
(1) COT Index >= 90, Buying interest at extreme
(2) COT Index <= 10, Selling interest at extreme
(3) COT Index >= 70, rising COT Index, monitor for a trend reversal
Down Trend and Up Trend is based on 50 Simple Moving Average

US Market 22 Aug 2020

US market closed mixed.  Dow and Russell closed lower while S&P and Nasdaq closed higher.

On the weekly chart, Dow closed with a -roc (closed price < open price) inside day.  Nasdaq broke lhf (lower-high formation).  Russell broke hlf (high-low formation) and closed with a -roc.

BDI closed lower while Harpex closed higher.

Dollar Index broke hlf.

Watch out for 

  • Jackson Hole Symposium on Thu and Fri
  • Fed Chair Powell Speaks on Thu

Instruments that show buying interest (3) from Dealer/Intermediary (sell-side participants)
UT 
  • S&P
  • Russell
Neutral 
  • None
DT 
  • None

Instruments that show selling interest at extreme (2) by Dealer/Intermediary (sell-side participants)
UT 
  • None
Neutral 
  • None
DT 
  • None
Note
(1) COT Index >= 90, Buying interest at extreme
(2) COT Index <= 10, Selling interest at extreme
(3) COT Index >= 70, rising COT Index, monitor for trend reversal
Down Trend and Up Trend is based on 50 Simple Moving Average


Dow
Daily UT, Weekly Neutral
Potential resistance around 28,195, 28,730, 29,106, 29,407
Potential support around 27,345, 26,635, 25,784, 25,336, 24,837, 24,170, 23,567

S&P
Daily UT, Weekly UT
Potential resistance around 3,391, 3,454
Potential support around 3,388, 3,303, 3,219, 3,155, 3,072, 3,022, 2,983, 2,940, 2,874

Nasdaq
Daily UT
, Weekly UT
Potential resistance around 12,040, 12,762, 13,485
Potential support around 11,318, 10,856, 10,595, 10,206, 9,873, 9,723, 9,243, 8,781

Russell
Daily 
UT, Weekly Neutral
Potential resistance around
 1,585, 1,609, 1,624, 1,649
Potential support around 1,543, 1,519, 1,498, 1,451, 1,420, 1,388, 1,341, 1,296

Key event to watch out  (SG Time, GMT+8)

24 Aug, Mon

  • 0645 New Zealand Retail Sales (QoQ)

25 Aug, Tue

  • 1400 German GDP (QoQ) (Q2)
  • 1600 German Ifo Business Climate Index (Aug)
  • 2200 US CB Consumer Confidence (Aug)
  • 2200 US New Home Sales (Jul)

26 Aug, Wed

  • 2030 US Core Durable Goods Orders (MoM) (Jul)
  • 2230 US Crude Oil Inventories 

27 Aug, Thu

  • 0800 US Jackson Hole Symposium
  • 1500 US Jackson Hole Symposium
  • 2030 US GDP (QoQ) (Q2)
  • 2030 US Initial Jobless Claims
  • 2110 US Fed Chair Powell Speaks 
  • 2200 US Pending Home Sales (MoM) (Jul)
  • 2315 Canada BoC's Governor Macklem speech

28 Aug, Fri

  • 0800 US Jackson Hole Symposium
  • 1500 US Jackson Hole Symposium
  • 2000 German Harmonized Index of Consumer Prices (YoY)
  • 2030 Canada GDP (MoM) (Jun)
  • 2030 US Goods Trade Balance
  • 2105 UK BoE Gov Bailey Speaks  
  • 2200 US Michigan Consumer Sentiment Index

30 Aug, Sun

  • 0900 China Non-Manufacturing PMI
  • 0900 China NBS Manufacturing PMI

Sunday, August 16, 2020

Dollar Index directionless

On the weekly chart, Dollar Index closed with a -roc (open price < close price)  inside day
Resistance at 93.3, 94.0, 95.0, TLD1, 96.3, 97.3, TLU4, 98.7, 99.8, 100.3
Support at 92.0, 90.6, 88.88


COT for Dollar Index


Weekly chart with 50 SMA

Commodities Update 15 Aug 2020

BDI closed higher to 1,595 (14 Aug) from 1,501 (07 Aug)

Harpex closed higher to 556.13 (07 Aug) from 521.54 (31 Jul)

COT 
Download Commodities COT
Instruments that show buying interest (3) by Producer/Merchant/Processor/User
Down Trend
  • Corn
Neutral
  • None
Up Trend
  • Soybean Meal
  • Natural Gas (1)
  • Gasoline
  • Palladium

Instruments that show selling interest at extreme (2) only by Producer/Merchant/Processor/User
Up Trend
  • None
Neutral
  • None
Down Trend
  • None

Note
(1) COT Index >= 90, Buying interest at extreme
(2) COT Index <= 10, Selling interest at extreme
(3) COT Index >= 70, rising COT Index, monitor for a trend reversal
Down Trend and Up Trend is based on 50 Simple Moving Average

US Market 15 Aug 2020

On the weekly chart, US market broke pwh (previous week high) and closed higher except for Nasdaq.  

Nasdaq broke hlf (high-low formation), recovered and closed higher with a small roc.  Dow closed above Jun's high.  S&P closed with a small roc.  Russell traded higher but the gain is trimmed and closed with small -roc (open price < close price).

BDI and Harpex both closed higher.

Dollar Index directionless.

Instruments that show buying interest (3) from Dealer/Intermediary (sell-side participants)
UT 
  • S&P
  • Russell
Neutral 
  • None
DT 
  • None

Instruments that show selling interest at extreme (2) by Dealer/Intermediary (sell-side participants)
UT 
  • None
Neutral 
  • None
DT 
  • None
Note
(1) COT Index >= 90, Buying interest at extreme
(2) COT Index <= 10, Selling interest at extreme
(3) COT Index >= 70, rising COT Index, monitor for trend reversal
Down Trend and Up Trend is based on 50 Simple Moving Average


Dow
Daily UT, Weekly Neutral
Potential resistance around 28,195, 28,730, 29,106, 29,407
Potential support around 27,345, 26,635, 25,784, 25,336, 24,837, 24,170, 23,567

S&P
Daily UT, Weekly UT
Potential resistance around 3,388, 3,391, 3,454
Potential support around 3,303, 3,219, 3,155, 3,072, 3,022, 2,983, 2,940, 2,874

Nasdaq
Daily UT
, Weekly UT
Potential resistance around 11,318, 12,040
Potential support around 10,856, 10,595, 10,206, 9,873, 9,723, 9,243, 8,781

Russell
Daily 
UT, Weekly DT
Potential resistance around
 1,585, 1,609, 1,624, 1,649
Potential support around 1,543, 1,519, 1,498, 1,451, 1,420, 1,388, 1,341, 1,296

Key event to watch out  (SG Time, GMT+8)

17 Aug, Mon

  • 0750 Japan GDP

18 Aug, Tue

  • 0930 Australia RBA Meeting Minutes
  • 2030 US Building Permits (Jul)

19 Aug, Wed

  • 1400 UK CPI (YoY) (Jul)
  • 1700 Europe CPI (YoY) (Jul)
  • 2030 Canada Core CPI (MoM) (Jul)
  • 2230 US Crude Oil Inventories 

20 Aug, Thu

  • 0200 US FOMC Meeting Minutes
  • 0930 China PBoC Loan Prime Rate
  • 1930 Europe ECB Publishes Account of Monetary Policy Meeting  
  • 2030 US Initial Jobless Claims
  • 2030 US Philadelphia Fed Manufacturing Index (Aug)

21 Aug, Fri

  • 1400 UK Retail Sales (MoM) (Jul)
  • 1530 German Manufacturing PMI (Aug)  
  • 1600 Europe Markit PMI Composite
  • 1630 UK Manufacturing PMI  
  • 2030 Canada Core Retail Sales (MoM) (Jun)  
  • 2200 US Existing Home Sales (Jul)

Sunday, August 9, 2020

Dollar Index closed with a +roc

On the weekly chart, Dollar Index broke pwl, recovered and closed with a very small +roc.
Resistance at 94.0, 95.0, TLD1, 96.3, 97.3, TLU4, 98.7, 99.8, 100.3
Support at 93.3, 92.0, 90.6, 88.88


COT for Dollar Index

Weekly chart with 50 SMA

Commodities Update 08 Aug 2020

BDI closed rebounded to 1,501 (07 Aug) from 1,350 (31 Jul)

Harpex closed leaping to 521.54 (31 Jul) from 484.87 (24 Jul)

COT 
Download Commodities COT
Instruments that show buying interest (3) by Producer/Merchant/Processor/User
Down Trend
  • Oats (1)
Neutral
  • Corn
Up Trend
  • Soybean Meal
  • Natural Gas (1)
  • Gasoline
  • Palladium

Instruments that show selling interest at extreme (2) only by Producer/Merchant/Processor/User
Up Trend
  • None
Neutral
  • None
Down Trend
  • None

Note
(1) COT Index >= 90, Buying interest at extreme
(2) COT Index <= 10, Selling interest at extreme
(3) COT Index >= 70, rising COT Index, monitor for a trend reversal
Down Trend and Up Trend is based on 50 Simple Moving Average

US Market 08 Aug 2020

On the weekly chart, US market broke lhf and closed higher.
Dow testing Jun's high.  Russell broke and closed above Jun's high.

BDI and Harpex both leapt higher.

Dollar Index closed with a +roc.

Instruments that show buying interest (3) from Dealer/Intermediary (sell-side participants)
UT 
  • Dow
  • S&P
  • Russell
Neutral 
  • None
DT 
  • None

Instruments that show selling interest at extreme (2) by Dealer/Intermediary (sell-side participants)
UT 
  • None
Neutral 
  • None
DT 
  • None

Note
(1) COT Index >= 90, Buying interest at extreme
(2) COT Index <= 10, Selling interest at extreme
(3) COT Index >= 70, rising COT Index, monitor for trend reversal
Down Trend and Up Trend is based on 50 Simple Moving Average


Dow
Daily UT, Weekly Neutral
Potential resistance around 28,195
, 28,730, 29,106, 29,407
Potential support around 27,345, 26,635, 25,784, 25,336, 24,837, 24,170, 23,567

S&P
Daily UT, Weekly UT
Potential resistance around 3,388, 3,391, 3,454
Potential support around 3,303, 3,219, 3,155, 3,072, 3,022, 2,983, 2,940, 2,874

Nasdaq
Daily UT
, Weekly UT
Potential resistance around 11,318, 12,040
Potential support around 10,856, 10,595, 10,206, 9,873, 9,723, 9,243, 8,781

Russell
Daily 
UT, Weekly DT
Potential resistance around
 1,585, 1,609
, 1,624, 1,649
Potential support around 1,543, 1,519, 1,498, 1,451, 1,420, 1,388, 1,341, 1,296

Key event to watch out  (SG Time, GMT+8)

10 Aug, Mon

  • Japan and Singapore Holiday
  • 0930 China Consumer Price Index
  • 2200 US JOLTs Job Openings (Jun)

11 Aug, Tue

  • 0750 Japan Current Account n.s.a.
  • 1630 UK Average Earnings Index +Bonus (Jun)
  • 1630 UK Claimant Count Change (Jul)
  • 1630 UK ILO Unemployment Rate (3M)
  • 1700 German ZEW Economic Sentiment (Aug)
  • 2000 US EIA Short-Term Energy Outlook 
  • 2030 US PPI (MoM) (Jul)

12 Aug, Wed

  • 1000 New Zealand RBNZ Interest Rate Decision
  • 1000 New Zealand RBNZ Rate Statement  
  • 1100 New Zealand RBNZ Press Conference  
  • 1400 UK GDP
  • 1400 UK Manufacturing Production (MoM) (Jun)
  • 1400 UK Monthly GDP 3M/3M Change
  • 2030 US Core CPI (MoM) (Jul)
  • 2230 US Crude Oil Inventories 

13 Aug, Thu

  • 0830 Australia Employment Change (Jul)
  • 1400 Herman Harmonized Index of Consumer Prices (YoY)
  • 2030 US Initial Jobless Claims

14 Aug, Fri

  • 1000 China Industrial Production (YoY) (Jul)
  • 1000 China Retail Sales (YoY)
  • 1700 Europe Gross Domestic Product s.a. (QoQ)
  • 2030 US Core Retail Sales (MoM) (Jul)
  • 2030 US Retail Sales (MoM) (Jul)
  • 2200 US Michigan Consumer Sentiment Index

Sunday, August 2, 2020

Dollar Index continues to slide

Dollar Index continues to slide, tested 93.3 support and closed just slightly above it.
Next strong support level is around 88.88.
Resistance at 94.0, 95.0, TLD1, 96.3, 97.3, TLU4, 98.7, 99.8, 100.3, TLU1, 102.3
Support at 93.3, 92.0, 90.6, 88.88

COT for Dollar Index

Weekly chart with 50 SMA

Commodities Update 01 Aug 2020

BDI closed rebounded to 1,350 (31 Jul) from 1,317 (24 Jul)
Harpex closed higher to 484.87 (24 Jul) from 463.10 (17 Jul)

COT 
Download Commodities COT
Instruments that show buying interest (3) by Producer/Merchant/Processor/User
Down Trend
  • Oats (1)
Neutral
  • None
Up Trend
  • Corn
  • Soybean Meal
  • Natural Gas (1)
  • Gasoline
  • Palladium

Instruments that show selling interest at extreme (2) only by Producer/Merchant/Processor/User
Up Trend
  • None
Neutral
  • None
Down Trend
  • None

Note
(1) COT Index >= 90, Buying interest at extreme
(2) COT Index <= 10, Selling interest at extreme
(3) COT Index >= 70, rising COT Index, monitor for a trend reversal
Down Trend and Up Trend is based on 50 Simple Moving Average

US Market 01 Aug 2020

US market closed higher except for Dow closed lower.
On the weekly chart, Dow broke hlf, S&P and Nasdaq closed with a +roc inside day while Russell broke hlf, trimmed some of the losses before closing with a -roc.

BDI and Harpex closed higher.

Dollar Index continues to slide.

Various countries will be reporting PMI data this week.  This Fri,  US NFP and unemployment data.

Instruments that show buying interest (3) from Dealer/Intermediary (sell-side participants)
UT 
  • Dow
  • S&P
  • Russell
Neutral 
  • None
DT 
  • None

Instruments that show selling interest at extreme (2) by Dealer/Intermediary (sell-side participants)
UT 
  • None
Neutral 
  • None
DT 
  • None
Note
(1) COT Index >= 90, Buying interest at extreme
(2) COT Index <= 10, Selling interest at extreme
(3) COT Index >= 70, rising COT Index, monitor for trend reversal
Down Trend and Up Trend is based on 50 Simple Moving Average


Dow
Daily UT, Weekly Neutral
Potential resistance around 26,235, 27,350, 28,195
, 28,730, 29,106, 29,407
Potential support around 25,784, 25,336, 24,837, 24,170, 23,567, 23,175, 22,776

S&P
Daily UT, Weekly UT
Potential resistance around 3,303, 3,391, 3,454
Potential support around 3,219, 3,155, 3,072, 3,022, 2,983, 2,940, 2,874, 2,854, 2,825

Nasdaq
Daily UT
, Weekly UT
Potential resistance around 11,318, 12,040
Potential support around 10,856, 10,595, 10,206, 9,873, 9,723, 9,243, 8,781, 8,428, 8,196

Russell
Daily 
UT, Weekly DT
Potential resistance around
 1,498, 1,519, 1,543, 1,585, 1,609
, 1,624, 1,649
Potential support around 1,451, 1,420, 1,388, 1,341, 1,296, 1,287, 1,259, 1,240, 1,213

Key event to watch out  (SG Time, GMT+8)
03 Aug, Mon
  • Canada Holiday
  • 0750 Japan GDP
  • 0945 China Caixin Manufacturing PMI (Jul)
  • 1555 German Manufacturing PMI (Jul)
  • 2200 US ISM Manufacturing PMI (Jul)
04 Aug, Tue
  • 0930 Australia Retail Sales (MoM) (Jun)
  • 1230 Australia RBA Interest Rate Decision (Aug)
  • 1230 Australia RBA Rate Statement  
05 Aug, Wed
  • 0645 New Zealand Employment Change (QoQ) (Q2)
  • 1630 UK Composite PMI (Jul)
  • 1630 UK Services PMI (Jul)
  • 1700 Europe Retail Sales
  • 2015 US ADP Nonfarm Employment Change (Jul)
  • 2030 US Trade Balance
  • 2200 US ISM Non-Manufacturing PMI (Jul)
  • 2230 US Crude Oil Inventories 
06 Aug, Thu
  • 1400 UK BoE Inflation Report
  • 1400 UK BoE Interest Rate Decision (Jul)
  • 1400 UK BoE MPC Meeting Minutes 
  • 1630 UK Construction PMI (Jul)
  • 2030 US Initial Jobless Claims
07 Aug, Fri
  • 0930 Australia RBA Monetary Policy Statement
  • 2030 US Nonfarm Payrolls (Jul)
  • 2030 US Unemployment Rate (Jul)
  • 2030 Canada Employment Change (Jul)
  • 2200 Canada Ivey PMI (Jul)